What is a polar diagram in sailing?
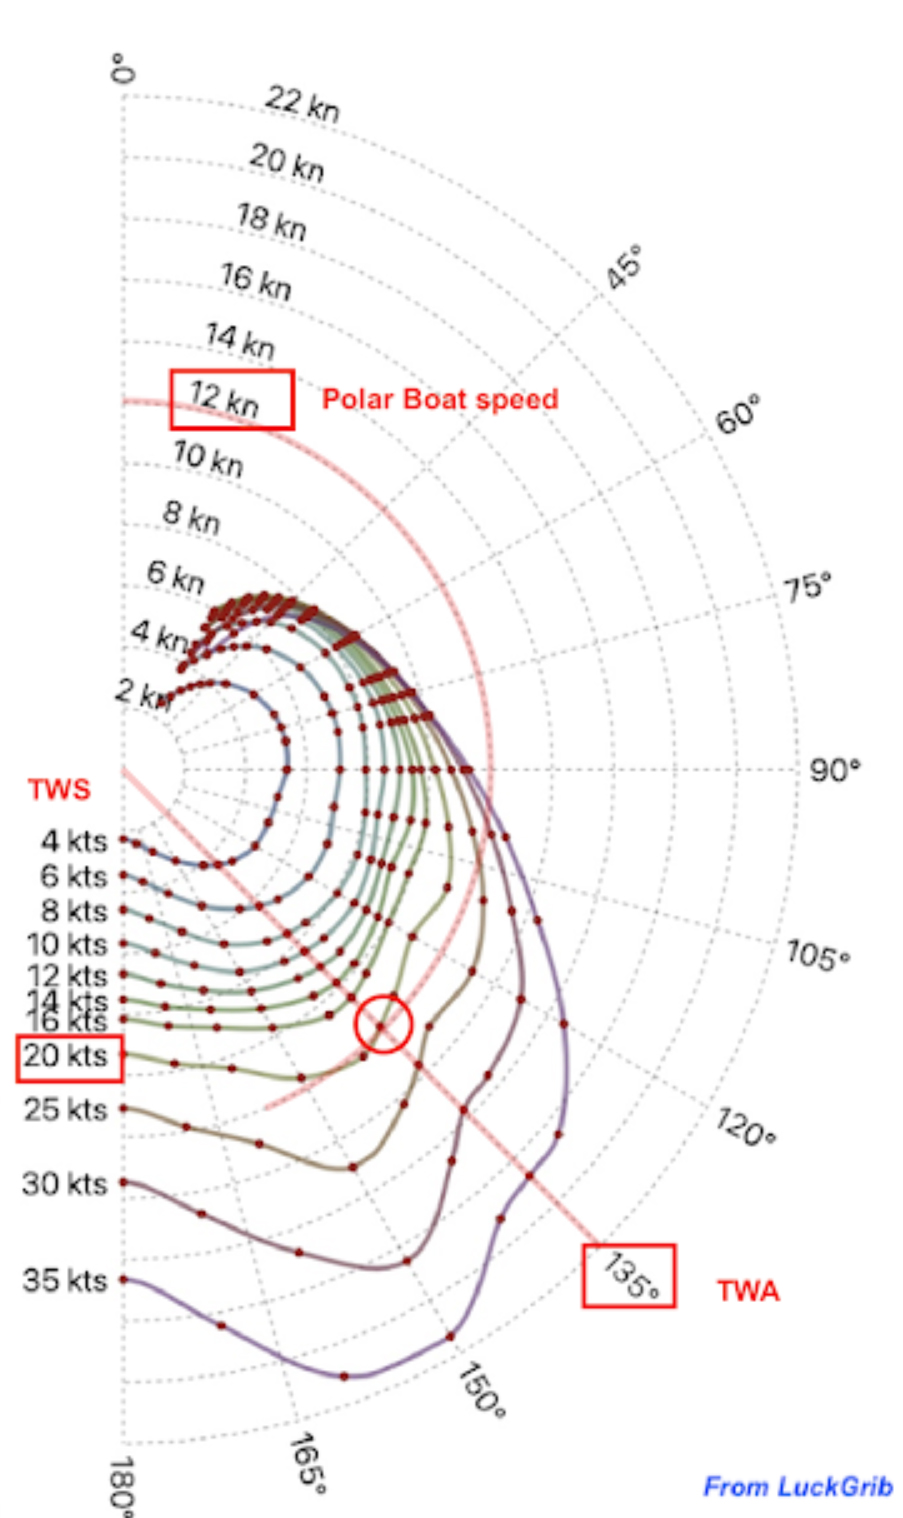
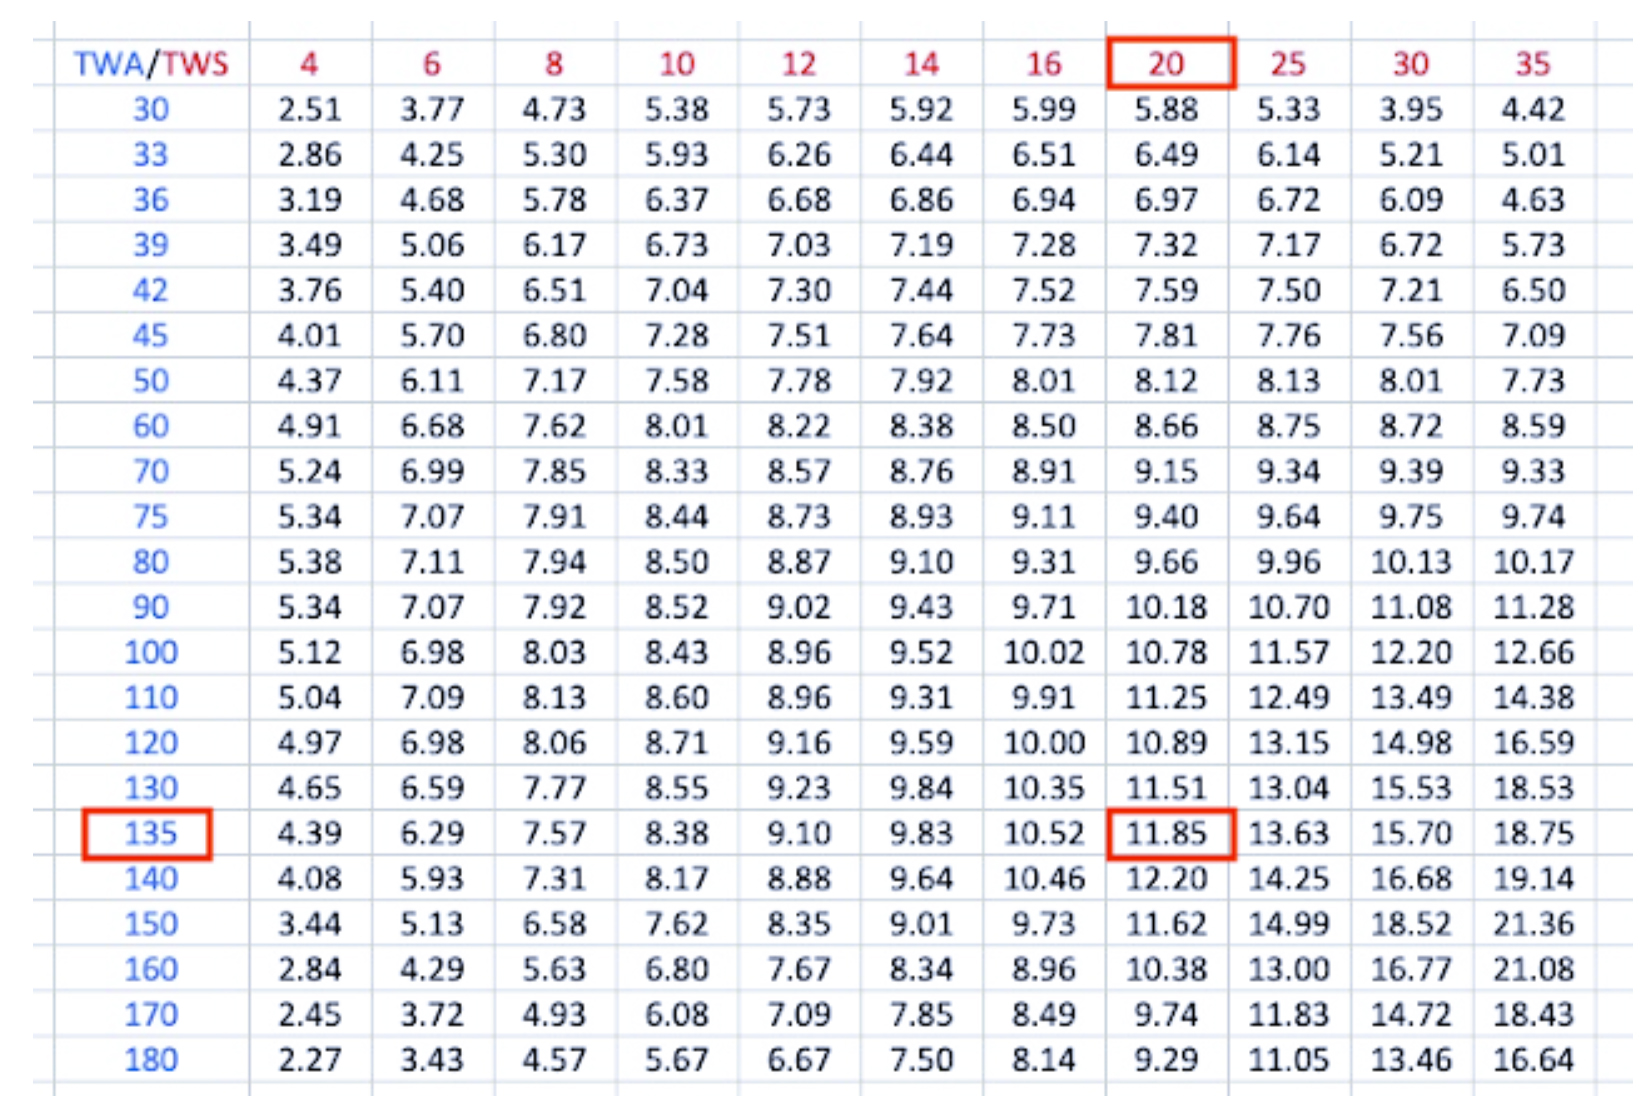
A polar diagram in sailing is a specialised chart used to represent a sailboat’s performance under various wind conditions. It provides valuable insights into the boat’s speed and efficiency depending on the wind angle and wind speed.
It compromises your bearing to your target against the speed you can make on that bearing. Simply put, you may sail towards the windward mark at 10 knots, having to cover 1 Nm. If you were to bear off 5 degrees, you would have to cover more than the original 1 Nm, but the polar diagram may show that you can sail at that new angle to the wind at 13 knots, thus reducing the overall time it takes to hit the top mark.
Here’s an overview of its key features and uses:
Key Elements of a Polar Diagram
Axes:
- The chart is circular, with the centre representing the boat.
- The angles around the circle (0° to 360°) correspond to different wind directions relative to the boat (e.g., 0° is directly upwind, 180° is directly downwind).
Wind Speeds:
- Several curves radiate from the centre, each corresponding to a specific true wind speed (e.g., 5 knots, 10 knots, 15 knots).
Boat Speed:
- Points along the curves indicate the boat’s predicted speed (in knots) at various wind angles and wind speeds.

How to Interpret a Polar Diagram
Optimal Sailing Angles:
- The shape of the curves shows the most efficient angles for sailing, where the boat achieves its best speed relative to the wind.
- Peaks in the curves often indicate the best angles for upwind and downwind sailing.
Downwind and Upwind Performance:
- Upwind performance is typically shown near 30° to 45° from the wind.
- Downwind performance is seen near 135° to 180°.

Practical Applications
Race Strategy:
- Sailors use polar diagrams to determine the best course for maximum speed during a race.
- Helps in choosing the right sail configuration for given wind conditions.
Performance Analysis:
- Comparing the actual performance against the polar chart can help identify inefficiencies.
Routing Decisions:
- In conjunction with weather forecasts, polar diagrams assist in plotting the fastest route over long distances.
Polar diagrams are often provided by the boat manufacturer or developed through sailing trials, and advanced versions can be integrated into onboard navigation systems.
See also: TWA and TWS

NAVIGATION RULES CLINIC + BASIC SAIL TRIM COURSE
Author
-

Rene is a keelboat instructor and sailing coach in the Mandurah area WA. He is also the author of several books about sailing including "The Book of Maritime Idioms" and "Renaming your boat".
View all posts


