Tides & Currents
So you set a course to steer, follow it for a few hours and realise that you are not going to hit your waypoint or destination. You check your previous heading calculations but this all seems correct. What has happened could well be related to tidal movements and currents. As you sail towards your waypoint, the tide or current simply pushes you off course. Nothing a bit of dead reconning won’t fix but perhaps there is a way to avoid this in the first place. Let’s have a look at how tides and currents influence your course, how we can recognise tides and currents on a chart and what we can do to compensate for this when we are plotting our course to steer.
What is tide?
Tidal currents are caused by the gravitational forces predominantly from the moon and the sun. But before we go into this let’s have a look at what the tide does and why it is so important that we know about the tide. We need to consider the tide when we are anchoring so we do not drift or run aground. However, in the context of this article, we will be looking at tidal currents as they relate to navigation.
The difference between low and high tide is called the tidal range and can vary dramatically depending on your location. For example, the Bay of Fundy at Burntcoat Head in Nova Scotia Canada could be over 16 metres (that is as high as a 5-story building) whereas some places in the Mediterranean can be as low as a few centimetres.
With the tide coming in and out we can obviously expect some sort of tidal current. Generally, the larger the tidal range the larger the tidal current but it is important to also consider if there are bottlenecks forcing large volumes of water through a relatively small channel.
For example, we can see this when we manoeuvre our vessel through a bar to get into the safety of a river or harbour. This could mean 40+ knot tidal currents as seen in Saltstraumen, Norway where 400 million cubic metres of tidal water needs to move through a strait that is only 150 meters wide…
It is interesting to note that tidal ranges occur predominantly close to shore. There is much less of it when out on the ocean…
Flood and ebb tides
Now to the chart. We all have seen a nautical chart before. We also know that if we call a nautical chart a “map” we owe the whole crew a beer. Although important, this is really beside the point so let’s move on… We get a lot of information from charts when it comes to tidal information. Let’s have a look at the most important symbols and terminology used…
Flood Tide
On a chart, a “flood tide” is an arrow with feathers. (remember “F” for both flood and feathers.) The arrow indicates the direction of the current and may have the tidal current displayed above it in knots. This is important to know because we can use this later to calculate a more accurate heading (a course to steer) as well as get a more realistic voyage time. A flood tide is a rising tide with water flowing in towards a high tide.

Ebb Tide
As opposed to a flood tide, an ebb tide is depicted with a plain arrow without feathers that indicates the direction of the current. It can also have the tidal current displayed in knots. Ebb tides are receding tides with the water flowing out towards low tide.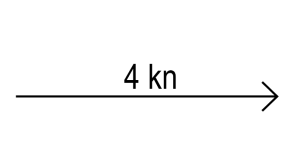
Spring and neap tides
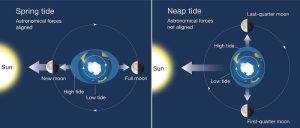
But wait, there is more… You may also have heard of spring and neap tides. Spring tides are higher than usual but have nothing to do with the seasons. It simply refers to a tide that springs up (I think). In any case, this occurs twice within a lunar cycle. Ie, during a full moon and a new moon (no visible moon). In essence, the moon and sun’s gravity are working in unison to create a stronger gravitational pull and hence create higher tide ranges.
Conversely, a neap tide occurs at the first and last quarter moon. In this scenario, the sun’s gravity pulls the water in a different direction to that of the moon’s gravity levelling out both gravitational forces resulting in a more moderate tidal range.
Additional effects
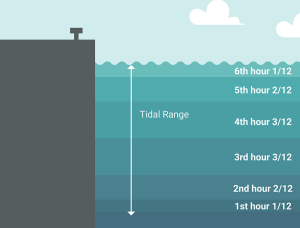
Things are never simple and tidal issues are no different. So finally, we can have a look at “the rule of 12“. In essence, it will tell us when the tidal currents are the strongest within the flood and ebb cycles. The rule explains that the 2 hours in the centre of the cycle produces 50% of the current. Ie, the third and fourth hour within the cycle.
The below graphic illustrates this although there are others that use a bell curve to show the same.
From the same graphic, we can see that the currents will be at a minimum the closer we get to the tide changing.
Why is this important? Well, you can use this information again when navigating. For example, your vessel may not have enough power to battle against a tidal current in the 4th hour of the cycle but may be okay to sail into a current in the 5th or 6th hour which may be a reason to delay your departure by a few hours. Alternatively, you may want to take advantage of a current and plan your departure time accordingly in order to save on fuel…
Where do I find tidal data?
In order to make good decisions, we need good data. This holds particularly true when navigating. So where can you find reliable tidal information?
1. Tide Tables
If you are a purist and think anything electronic is evil and dangerous then consulting your tide tables is the way to go. These are published periodically so you need to keep these up to date. Australian National Tides Tables will set you back $55 but there are cheaper publications available. Still, it is a good thing to have on your boat.
Is using tide tables user-friendly and intuitive? NO. Is it accurate and reliable? YES. Is it good for planning? YES.
Personally, I do not use this very often but still a “good to have” redundancy. system…

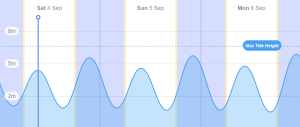
Using an App
I can hear it already…”You can’t rely on electronics!” Fine, we just list it here as an option. These types of Apps (like Willy Weather) get their information from the same source as the publishers of the paper tables.
Is using an App user-friendly and intuitive? YES. Is it accurate and reliable? YES. Is it good for planning? YES.
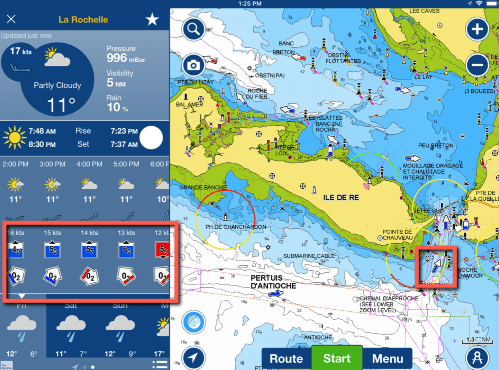
Nav Software
Plotters will come equipped with lots of peripheral data such as wind and tidal information. For example, Navionics will tell you many things about the tidal conditions although there is (as with most things) a learning curve. Personally, I do not use this for “planning” but regularly refer to it to see what the tides are doing when we are on the go…
Is using a plotter user-friendly and intuitive? YES. Is it accurate and reliable? YES. Is it good for planning? NO.
Calculating Distance/Speed/Time

Okay, we are getting there. One more thing before we go into using tidal data to calculate our course to steer. The “Distance – Speed – Time” triangle. In essence, we can find one of these if we know the other two.
Finding time
For example, if we want to know what time it will take to reach our destination and we know the speed of our yacht and the distance to our destination then we can simply apply this triangle (see above). Cover what you want to know and apply the formula. Ie, if we want to know time we cover it and are left with distance ÷ speed.
So if we know our yacht’s speed is 5 knots and we have determined that the distance is 32 nm then 32 ÷ 5 = 6.4 hours. Because we use time in hours and minutes we simply multiply the decimal 0.4 x 60 to get 24 minutes. So the time it will take to cover 32 nm at 5 knots is 6 hours and 24 minutes.
Finding distance
For example, if you want to know how far you sailed cruising in a straight line for 3 hours and 20 minutes at an average cruising speed of 6.5 knots then the triangle can help you out again.
This time we know speed (6.5) and time (3 hours and 20 minutes) and want to know the distance. Simply cover distance on the triangle and you are left with speed x time. Just remember that “minuted” needs to be converted into a decimal so simply divide the 20 minutes by 60 and you get 0.333. Therefore time is 3.333 hours. 6.5 x 3.333 = 22.66 nm. So you travelled 22.66 nm.
Find speed
Feel free to skip this if you are familiar with the formula. However, to make this bulletproof we will have an example of calculating your speed.
Say you sail your first leg on a long ocean race. You know this leg is 15.6 nm and it took you 2 hours and 43 minutes. You are now curious to find out what speed you did.
We cover speed on the triangle and are left with distance ÷ time. Ie, 15.6 ÷ 2.717 = 5.74 knots (remember the 43 minutes ÷ 60 to get the decimal time)
So you can calculate speed, distance and time as long as you know the other 2 variables. You can also use the calculator at the bottom of the article. Enough of that…
Applying tidal data
It is not much use knowing about tidal information if we can’t do anything with it. Well, we can…
We can use tidal data to calculate a more accurate heading and course to steer (CTS) and also calculate a much more accurate estimated time of arrival (ETA).
Let’s say we sail from A to B and draw this on our chart with a straight line (see below). We determine the bearing by using our parallel ruler. We position the ruler on our line and “walk” it to the compass rose on our chart where we read 90°T. Then if we put our dividers across our drawn line and then take them to the side of our chart we can see what distance we will cover. Let’s say it is 7.2 nm (distance √). We know that we cruise at an average of 6 knots (speed √). We know that distance divided by speed gives us time so 7.2 ÷ 6 = 1.2. Then 0.2 x 60 = 12 so we expect this trip to take 1 hour and 12 minutes.
However, we notice that there is a 2.5-knot flood tide that runs perpendicular to our course. We can tell by the feathered arrow with the speed above it. So we need to incorporate this data into our course planning otherwise this tidal current will push us off course.
So what will this current do to our course? We know that the trip takes 1.2 hours. This means that our vessel will drift off course at 2.5 knots (speed √) for 1.2 hours (time √). We can now multiply the speed (2.5 knots tidal flow) x the trip time (1.2 hours) = the distance (3 nm). This means we will be pushed 3 nm away from our true destination. So intuitively you will simply point your vessel to some degree into the current to compensate for the tide and you will be right to do so. But can we accurately set a course to steer (CTS) so we end up at our destination despite the current? Yes…
I did mention before that we will “drift” off course. So perhaps now is the time to touch on the last ingredients of this tidal business: set and drift…
Set & Drift
The phrase “set and drift” is used to explain outside forces such as wind and currents that affect a vessel’s ability to stay on its planned course.
In a nutshell, set = direction and drift = speed. Ie, when we talk about “set” we refer to the direction of the current and when we talk about drift we refer to the speed of that current.
So let’s go back to our example…
- Calculate the destination between A and B (7.2 nm)
- Divide distance by speed to get the time it takes to reach the destination 7.2 nm ÷ 6 knots = 1.2 hours).
- Calculate the set of the current 2.5 knots x 1.2 hours = 3 nm.
- Apply this 3 nm (drift) from your destination in the opposite direction (set) to the current (see line 2 below).
- Draw a line from your start point A to the end of line 2.
- Walk that angle of line 3 to your compass rose and read the degrees (let’s say 65°T).
- Apply the chart’s magnetic variation (see below) to calculate the compass magnetic heading. This will be your course to steer (CTS).

True vs Magnetic
Okay, one more thing that is handy to know within the context of navigation and currents and in particular your CTS. This has to do with the difference between true (or grid) and magnetic headings. A heading you get from your chart is not the same (in most cases) as the heading you use as a CTS. There are two variables that you need to compensate for. Ie, variation (or declination) and deviation…
Variation
Magnetic heading is your direction in relation to magnetic north. You get this from your magnetic compass. True heading is your direction in relation to true north, grid north or the geographic north pole. You find all this on your chart. The difference between true and magnetic is referred to as “variation“.
You can find the variation on your chart. In most cases, this information forms part of your “compass rose\”. There are several of these on your chart so the closest to your course will be most relevant.
It gives you the variation and the year it relates to. This could change over the years so you may need to do a calculation to derive your up-to-date variation. For example, in the Whitsundays (AUS824 1:150000) the variation reads 8°30′E 2004 (1′W). So in 2004, the variation was measured to be 8°30′E but for each year it moves 1′W. Let’s say that we are in 2021 so we can expect the variation to be 2021 – 2004 = 17′ W. We then subtract the 17′ from 30′ to get 13′. So in 2021, we can apply a (rounded) magnetic variation of 8°E.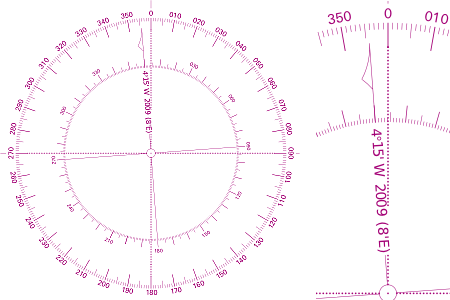
So if you read 65° on your chart as per the previous example then this is not your CTS. If you were in the Whitsundays, you would need to subtract the 8° from your 65° to get your magnetic bearing. So your CTS will be 57°.
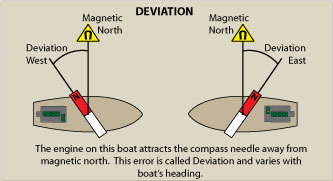
Deviation
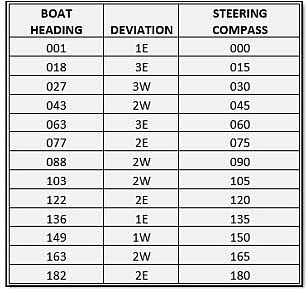
If you have a calibrated compass you will be able to apply your compass deviation. The calibration identified errors in your compass and tabulate this so you can achieve accurate compass readings. The difference is referred to as “deviation“.

If you find yourself on a commercial vessel or you are lucky enough to have a celebrated compass then you can apply your deviation to achieve better accuracy. A calibrated compass simply means that a specialist with special tools looks at your compass and identifies inaccuracies. They then tabulate these inaccuracies and then charge you a lot of money. To use the data simply apply the information on the table with some rounding.
So to go from a true to a compass bearing the below acronym is often used. A memory aid among sailors goes: True Virgins Make Dull Company.
- True – get this from your chart
- Variation – from your compass rose on your chart
- Magnetic – equals T ± V
- Deviation from your tabulated compass data
- Compass – equals M ± D
Well, that is just about it… Hopefully, you will be able to set your CTS accurately on your next trip using tidal information.
Note that this article is meant as general information as it only touches the surface of what is a complex matter. However, if you feel like I omitted important information or you feel some of the information is not accurate, then why not leave a comment below…